4 January 2022 - 14 January 2022 | Week 1 - Week 2
GCD60504 | Information Design
Individual task
Figure 1: Data, sorted, arranged, presented visually, explained with a story.
Figure 2: Some great examples shared by the lecturer.
Tue | 4 January 2022
I had my first class of Information Design today. We are briefed through the assignments for this semester and the first assignment begins - Buttons (or other stuff). The lecturer's idea of an "emergency kit" is really interesting and matches the occasion (flood), I would really go for that if I could not find anything.
I proceed to search around my house and found a glass of paper strips, but nah.
Figure 3: A glass of paper strips
Then I continued searching and remembered that a have a box of wooden stuff, which I collected earlier when I was young because I like the texture of wood.
Figure 4: A box of wooden stuff
"Maybe too many things" - thus thinking of using one of them only. I thought that these wooden blocks look nice, can put it like an art gallery. The texture at their sides is so beautiful and unique. Thinking of categorizing them using their textures.
Or how about fish? --- drying "salty" fish 🌈
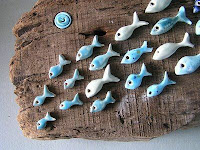
Figure 6: A bowl of wooden fish 

Figure 7 & 8: Fishy
Referring to Figures 2 & 9-12, I tried placing them as a big school of fish. The ones left out (on the left-side) are actually separated to categorize them with their smaller sizes compared to the right-side fishes.
Figure 9-12: References on Pinterest about the placement ideas
Figure 13: A messy big school of fish
Wed | 5 January 2022
A day of practising my patient skills :D. Tried stacking them up like a 3D graph. It was hard and frustrating as it kept falling the whole night.
Figure 14: 3D graph made of fish
Thu | 6 January 2022
Just a moment of appreciation and celebrating the success of building "leaning towers of fishes", before it falls again before I need to move the base nearer to the chair :D
Figure 15: My leaning tower of fishes
Fri | 7 January 2022
Then I write out the words on the paper. It was another series of rebuilding the tower but I got better and faster at stacking them up. While taking the picture, the background kind of looked messy so I added some papers on the base to cover up the black table and the towers fall several times again.
Figure 16: This should be the final look but I am not satisfied with it as it's lacking the story part
It falls again and I don't want to continue stack blocking again :P
Figure 17: Marks the end of my 3D graph
Sat | 8 January 2022
Figure 18: Trial three
Referring Figure 19, adds a fishing net to categorize some fish (defect fish). The previous idea of categorizing the fish according to their sizes is still here.
Figure 19: Reference on Pinterest
Figure 20: Fish captured by cat using a net
Figure 21: A bigger fishing net is drawn to put a table of data
Mon | 10 January 2022
Started watercolour painting. The last time I used watercolour was during secondary school in 2018. Felt like a beginner again :')
Can't see the pencil sketches anymore and I doubt my table can be seen by writing with a pen on the paper so I used plastic (?) because it is semi-transparent which the background will not be completely blocked. Kinda sceptical of the idea too. As the plastic flew away with my breath accidentally puffing on it, this idea was trashed. Proceed to darken the colour of the sea first.
Figure 21: Plastics were used to create a table
Figure 22: Light passes through the ocean
Tue | 11 January 2022
Thinking of adding a whale to place the table because it's the largest underwater animal, and finally decided to put a beluga instead, because it's light-coloured.
Figure 23: Beluga
Figure 24: Pre-final
Thu | 13 January 2022
After doing more research on the other practices (bad to good infographics), I start thinking of how I can improve my work. Here's what I improved on:
- TABLE
- Added a frame/box for the table.
- Changed the term "Above sea level" and "Under the sea" to "Sky" and "Sea" - more straightforward.
- Coloured the table cells with respective colours.
- LEGEND
- Added the "Legend" word.
- Use 'icons' and short-form (S stands for small fish; L stands for large fish) - clearer explanations.
- BACKGROUND
- Drew the distinguishing line between sky and sea. Also wrote the "Sky" and "Sea" on their respective space.
- Marked the fish with the letters S & B as the difference of the fish size is not obvious by directly looking at them. Refer to Figure to see the comparison of the fish sizes.
- Instead of using plastic to write the total number of fishes, changed to use paper.
Figure 25: Changes made
Fri | 14 January 2022
Here's how the final poster looks like :D
Figure 26: Final version for Exercise 1 - Quantify Data


Comments
Post a Comment